

Are the Arizona Coyotes a Good Investment?
Are the Arizona Coyotes a Good Investment?
A comparison of the Coyotes to their sister expansion teams suggests no.

The Big News
As you’ve probably seen in the news, Arizona voters have rejected the three propositions related to building a new arena for the Arizona Coyotes. Cases have been made for and against this expansion team in the Southwest. Some claim the NHL needs a team here in the name of true expansion and exposure while critics argue that ice hockey has no business existing in the desert.
While the future of this franchise is in limbo right now, I wondered if Arizona’s team is as bad as my initial gut reaction was and do expansion teams really struggle? Click here to see a list of data terms used in this article.

Expansion Team Performance
My initial question was “how bad does a team have to be in order for it to move?” followed by “how long does the team have to be that bad before they find a new home?”
I started out with a quick look at expansion teams/relocated teams from the last 40 years. Instead of comparing win-loss records for each team, I calculated the team’s overall win percentage. Using this statistic would allow a more fair evaluation of performance between teams where the largest age difference was 39 seasons. The count of seasons listed below does not include the season of the lockout.
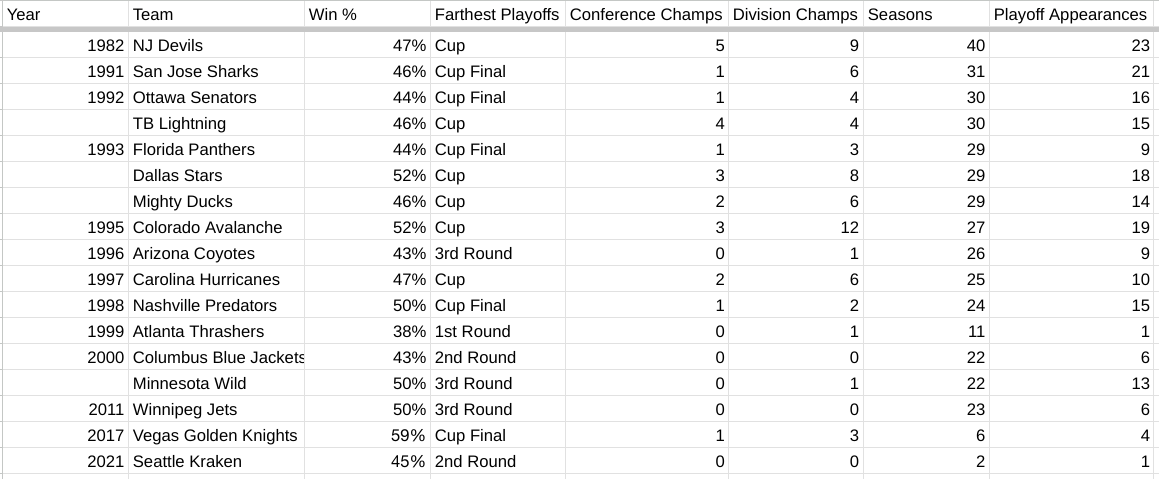
At first glance, Arizona doesn’t seem to be all that terrible. They’ve been to the playoffs as often as the Florida Panthers and their win percentage isn’t the worst of the bunch. So why couldn’t I shake the notion that this team was really not good?
A Closer Look
There’s this notion in data analytics called “granularity”. It refers to the level of detail used when analyzing data. If you look too closely at the data, you will lose the ability to see trends and patterns. If you look too broadly at the data, and you could lose the ability to explain or understand what is happening. You’ve probably heard of the expression “can’t see the forest for the trees”; being too close to the tree and all you see is bark. Too far away and you can’t make out any details about the trees. But if you can find the right distance, you will see the different kinds of trees. The same goes for data analysis.


Time to Zoom in
I suspected that the 43% win percentage for Arizona was skewed because of a handful of successful seasons. To check this theory, I calculated the win percentage of each season for the team.
I also wanted to check if I was being fair in my suspicion of Arizona. Was I being too hard on this “young” team? Were other 1990s expansion teams also just “meh”?
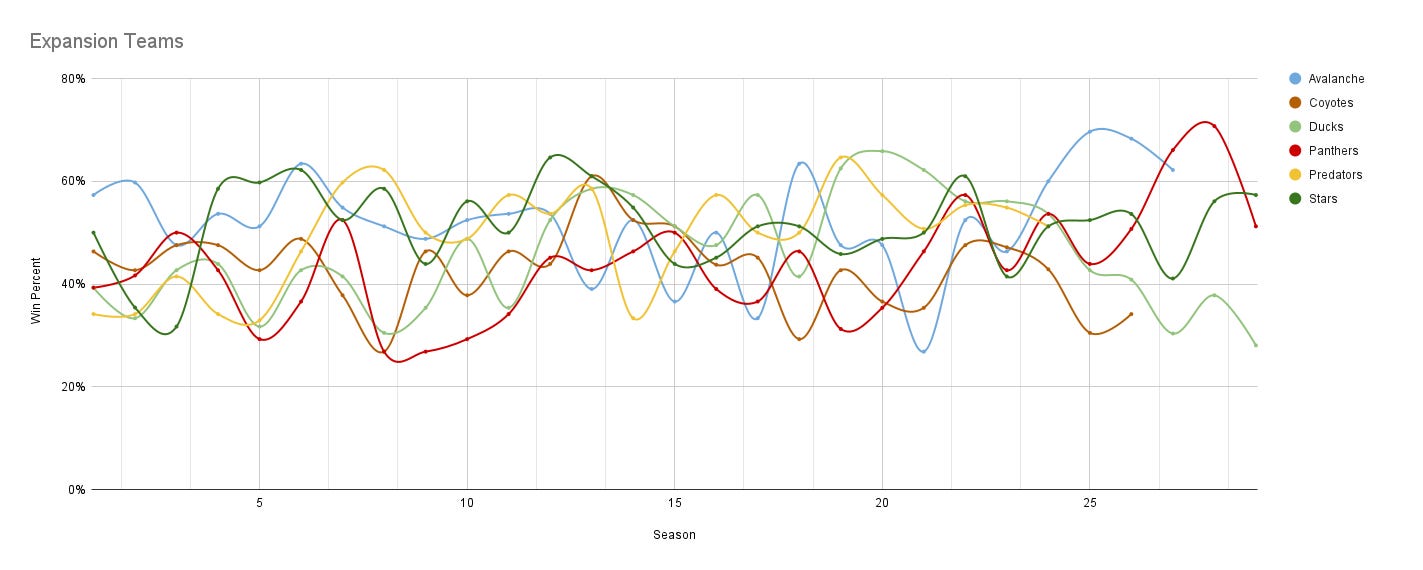
In order to compare the teams to each other equitably, I numbered each season instead of identifying the season by the year. This new dataset consisted of:
Anaheim Ducks (1993)
Dallas Stars (1993)
Florida Panthers (1993)
Colorado Avalanche (1995)
Arizona Coyotes (1996)
Nashville Predators (1998)
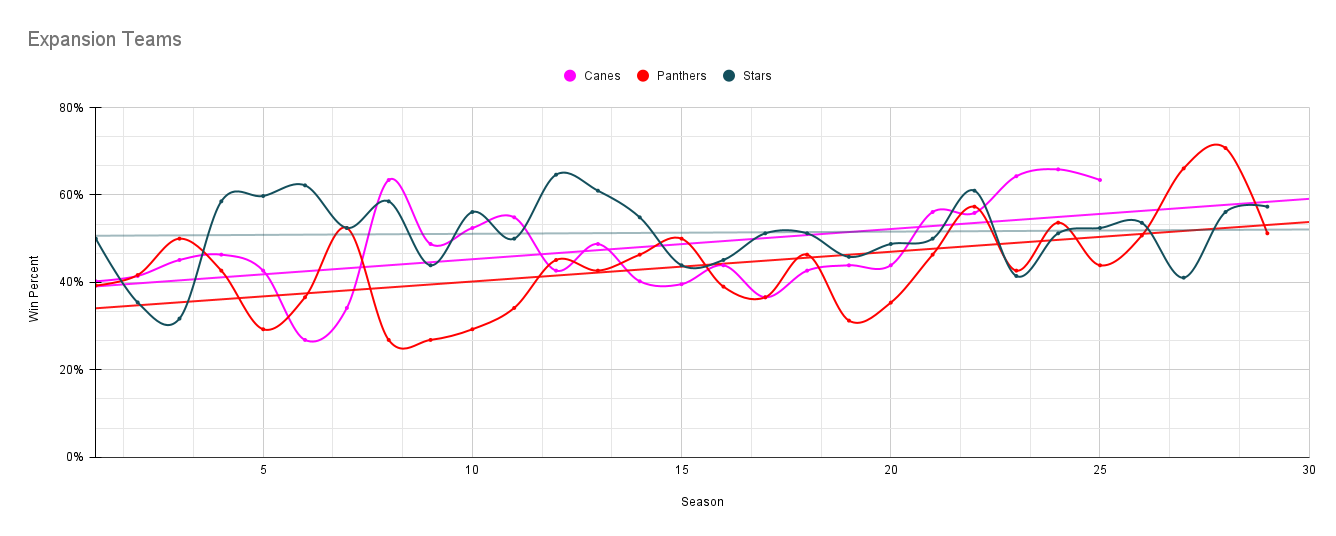
There it is.
By zooming into the data, I was able to spot what was going on with Arizona. This rainbow bowl of spaghetti represents the win percentage of each team by season. Don’t be scared, I’m about to point out the good stuff.
Arizona
First, let’s take a look at Arizona all on its own.

I’ve added a trendline to this line graph. It takes into account all of the available data and uses it to predict the direction the team’s performance is headed. And just as my gut was telling me, it’s going down. Based on past performance, the future does not look bright for Arizona. But how does this stack up against its sister expansion teams? Is this the curse of being the product of the ‘90s expansion boom? Let’s compare.
Dallas vs. Arizona
Before this exploration, there is no way I would have ever lumped Dallas in with Arizona in any way. They do, however, share some things in common. While Dallas was born from the Minnesota North Stars, both teams were established in the south in the mid-1990s. My gut tells me that Dallas has been a great team forever, so does it bear out in the data?
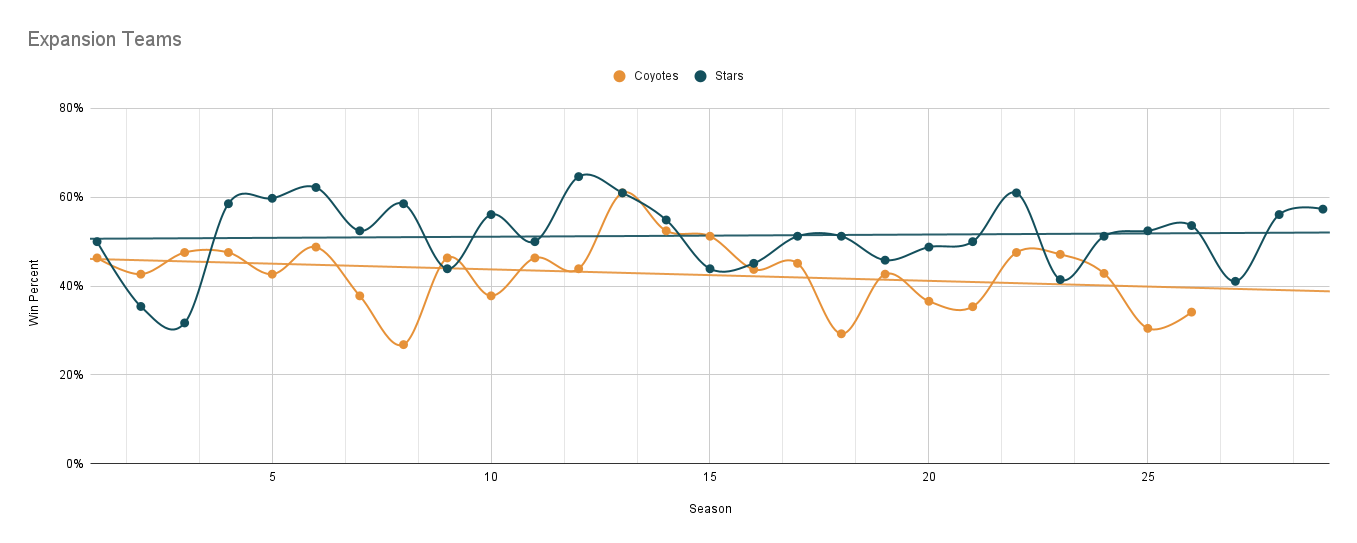

Not only does Dallas have a consistently better win percentage from season to season, its trendline is relatively flat. What does that mean? That they are expected to continue to perform at this successful level into the future. They’ve almost always been good.
Florida vs. Arizona
What about another team from the south that, historically, hasn’t been all that great? The Florida Panthers joined the league in 1993 as the state of Florida’s second franchise.
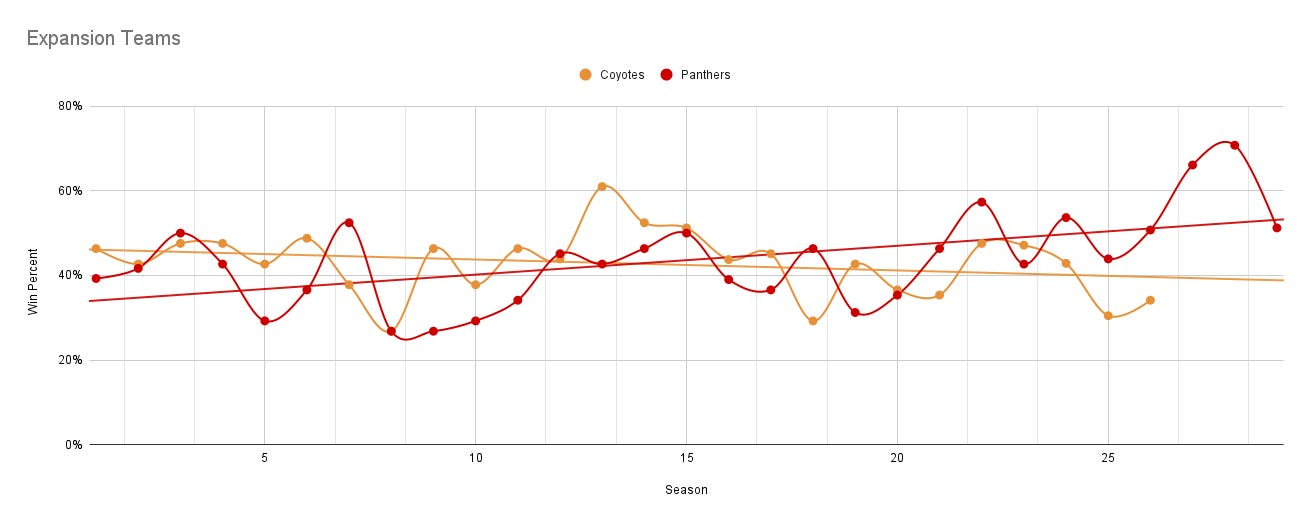
This graph is very interesting to me! Both teams performed fairly similarly for their first 20 seasons. But Florida’s trendline is showing positive growth. The future is looking very bright in the sunshine state for the cats - and it should after all the cash they’ve thrown around.
Anaheim vs. Arizona
Finally, what if we choose a team that has definitely NOT been good over the last few years? Dallas has always been great and Florida is really moving into the next tier of performance. Anaheim joined the league in 1993 and immediately had to compete for attention against another local, more established expansion team (LA Kings).
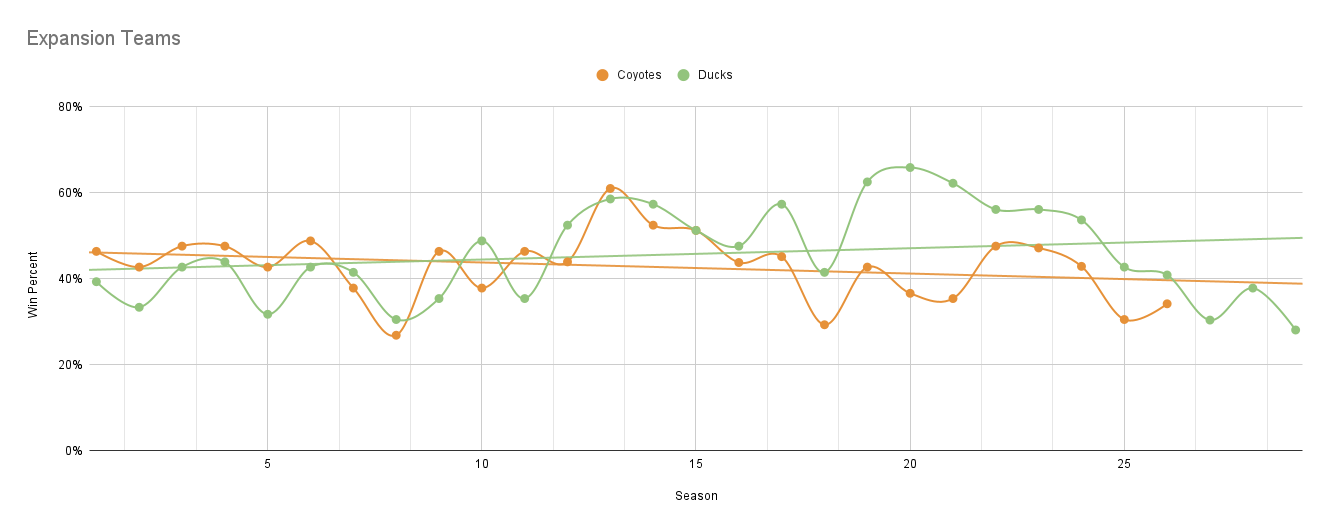
Even the Ducks, who haven’t made the playoffs in 5 seasons, show a positive trendline.
So where does that leave Arizona?
At this point, I am not surprised that the voters of Arizona don’t find the Coyotes to be a good business deal. Every team has its ups and downs. But for some reason, hockey goes to Arizona to die. In the 2023 Conference Championship, three of the four teams came from the same expansion period.
Key data terms:
win percentage: the number of wins divided by the total number of games played in a season; the percent of games won.
trendline: an equation that demonstrates the relationship between the x-axis (season) and y-axis (win %).